When it comes to analyzing business data in any industry, analysts often want to see performance compared with last month, last quarter, or last year. It’s critical to understand trends and to see the impacts that optimizations are making on KPIs.
As a publisher with programmatic inventory, you might want to answer questions such as:
- How is revenue, impression, and CPM performance trending across my exchange partners month-over-month?
- What are the trends across my top advertisers year-over-year?
- How is the geographic make-up of my audience trending month-over-month?
Now, in ProgrammaticIQ, you can add a Comparison Chart to any of your dashboards to easily identify trends in changes across your top metrics.
What is the Comparison Chart?
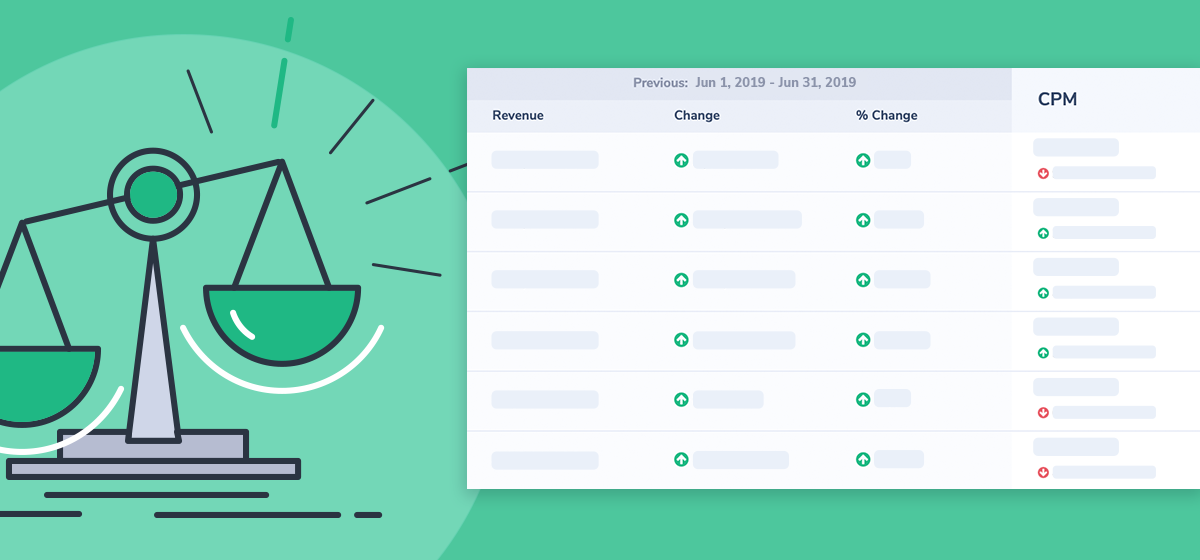
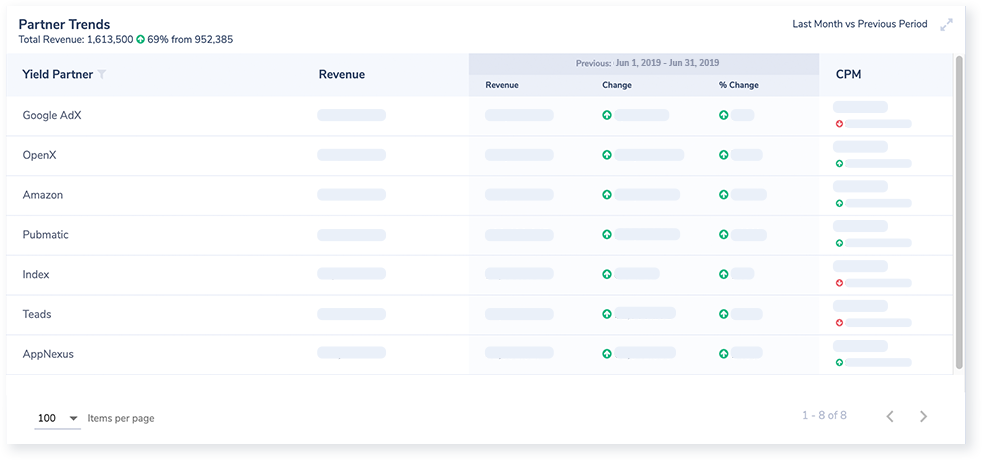
The Comparison Chart is a powerful chart that allows you to compare any metrics from your Data Sets across two different time periods. You can slice up your data by one or two dimensions to monitor changes across channels or partners. This chart also allows for a deeper dive with a Primary Metric. You can include up to three metrics and the selected Primary Metric will be highlighted in the comparison time period, along with the total change and the percent change in separate columns, allowing you to sort your data based on these additional fields. The metrics following your Primary are called Secondary Metrics and can provide supporting data for additional context.
How to Add a Comparison to Your Dashboard
1. Add a ‘Comparison’ Card.
You will now see the ‘Comparison’ Card option when editing a dashboard. Drag or double click the icon to add the Card to your dashboard. You can resize the chart as needed to fit your desired layout.
2. Identify the business question.
The most important step in this process is understanding the question you need this chart to answer. This will allow you to identify which fields are necessary to answer that question and make sure that they are available to you in the Data Set you choose.
3. Choose your dimensions.
After selecting the relevant Data Set for your new Card, choose the dimension (or dimensions) that will group your data. For example, you might want to use ‘Yield Partner’ in order to look at performance across programmatic vendors.
4. Select the metrics you want to track.
The most common metrics we see used with this chart are ‘Impressions’, ‘CPM’, and ‘Revenue’, but you can choose any metric available to you in that Data Set. The first metric in the list across the top of your dashboard will always be your Primary Metric. You will need to reorder your tiles if you want a different Primary Metric.
5. Choose your time periods.
The chart will default to Month-to-Date vs Previous Period, but you can always customize the current reporting period and the time frame you're comparing to. We provide a set of standard moving-window time periods such as Year-to-Date, Last Quarter, Month-to-Date, and more. You can also customize the period with ‘Last N Days’ or chose a static custom date range.
For more detail on adding a Comparison Chart and the set-up process, visit the Ad-Juster Help Desk.