Get More from Your Programmatic Advertising Data
You can take advantage of all the following types of Programmatic Data Management reports to gather, organize, and optimize the data flowing throughout your operations. The following reports are simply what’s immediately available, “out of the box.” There are numerous other reporting combinations available to you. Plus, our Account Management and Technical Client Services are always there to help you get the most from your data and assist with any custom reports you might need.
Our Programmatic Data Management solution leverages our unique data normalization technology, which unifies, transforms, and standardizes terms and values across incongruent platforms. To continue improving the capabilities our data normalization technology, we’re dedicated to expanding the terms included in our industry-first data dictionary.
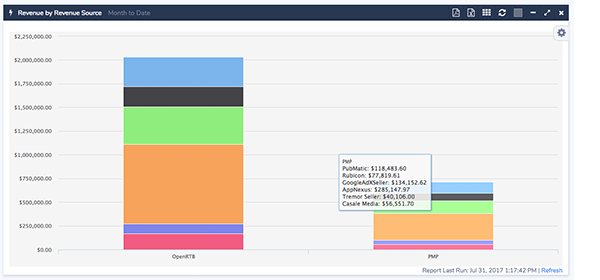
Buyer by Deal by Revenue Source
This query populates the Buyer by Deal by Revenue Source dashboards, showing the breakdown of the different revenue sources, including real-time bidding (OpenRTB) and private marketplace (PMP) deals. The stacked colors clearly show the distribution between your different sell/supply-side platform (SSP) partners. This allows you to see the breakdown of how your programmatic strategy is performing. A suggestion here is to experiment with the different graph types, such as Revenue by Deal, to see which exact types of reports will provide the data breakdown you need.
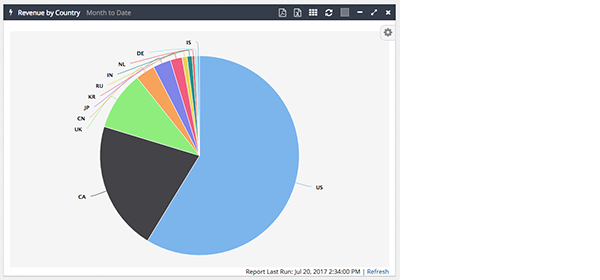
Advertiser by Country
This query populates a Revenue by Country pie chart. Using our data normalization technology, our Revenue by Country reports leverages the ISO code column to organize your data by country names.
Revenue by Country also populates Ad Server/SSP dashboards. This is one of our most common queries because most SSPs will show country and advertiser data.
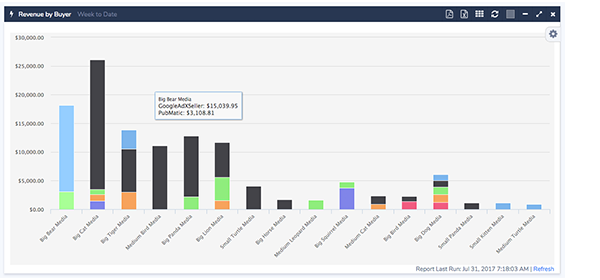
DSP by Buyer by Site
Revenue by Buyer shows which media buyers are buying on specific sites. It’s important to look at the distribution of the stacked colors (each color represents an SSP partner). This visualizes the unique demand that each SSP offers. For example, this color stacking helps you quickly identify which partners aren’t bringing any additional media buyers to your sites. Likewise, it also helps pinpoints those with the greatest unique demand, showing you where to invest your resources.
The Revenue by DSP graph shows the distribution of specific DSPs connecting to your sites. You can use this DSP information to infer performance points such as fill rate.
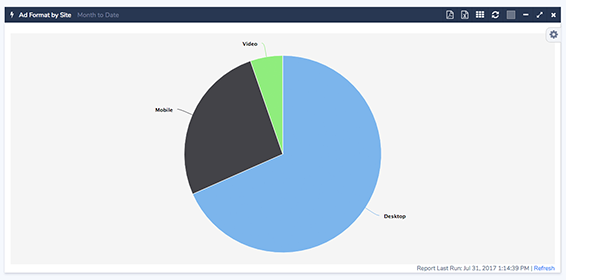
Ad Format by Site
Break down and gather your programmatic data according to all the common ad formats: mobile, desktop, and video.
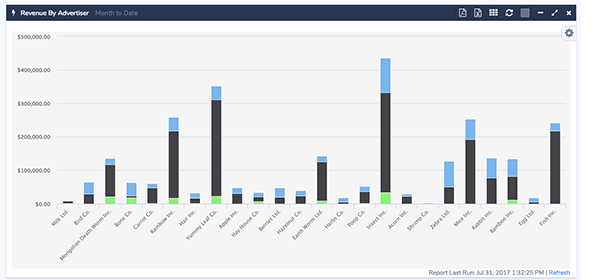
Advertiser by Ad Size by Device Category
Revenue by Advertiser shows which advertisers are spending the most on your sites. This vitally important report makes it easy for your programmatic team to quickly identify your best producers. Among other benefits, knowing which advertisers have the largest ad spends can help you discover opportunities for additional direct deals or PMP deals.
If you'd like to see advanced reporting options or visualizations tailored to your use case, request a Programmatic Data Management demo today!


