Your Single Source and File Import Data Sets in ProgrammaticIQ contain fields from one specified source. When you create a Data Set, all data from the selected dimensions and metrics will be included. But sometimes you may want a filtered version of your Data Set to avoid filtering at the visualization or report level.
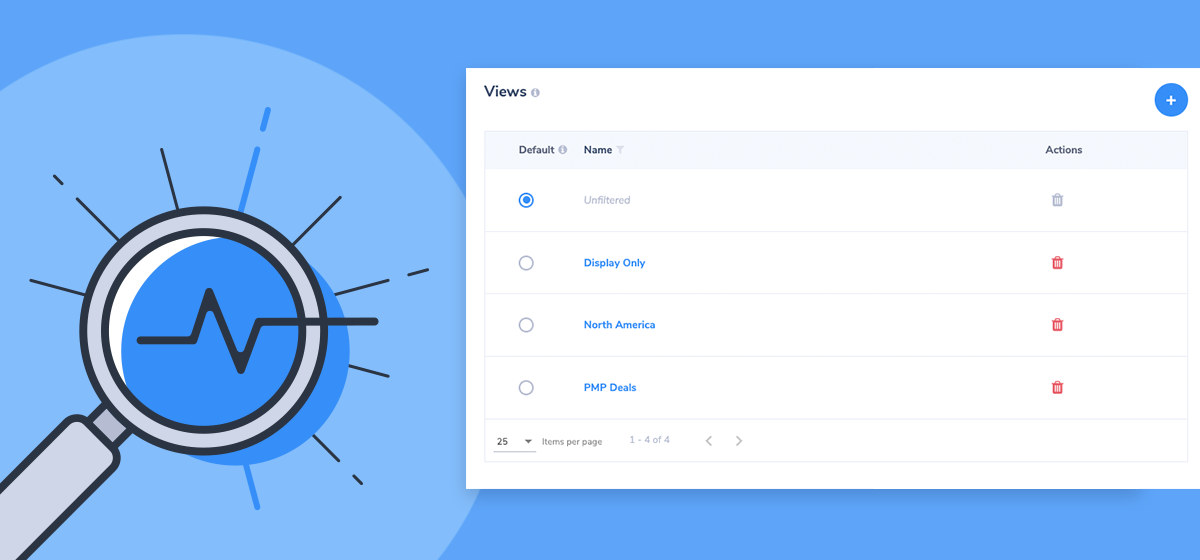
A Data Set View is a subset of an existing Data Set. With Data Set Views, you can now easily create different versions of your data set with custom filters and fields tailored to your use case!
Streamline data prep with easy filtering
Create a new View to filter data in or out of that Data Set or add a unique set of Custom Fields. Now, your Views are conveniently available to use when building Aggregate Data Sets, dashboards, and reports.
Data Set Views can be used to:
- Avoid duplicate fields when pulling data from header bidding platforms and overlapping data directly from other partners. This way you can aggregate the two Data Sets without double counting metrics such as revenue and impressions.
- Focus in on the data you care about with a filtered subset of your data. For example, if you only wanted to look at video data you would create a View that filters on Ad Format.
- Organize views for stakeholders. For example, when you’re pulling in data for many sites or publishers you may want to have a unique View set up for each site or publisher.
Creating a Data Set View
Create a new View for a Single Source or File Import Data Set by navigating to the Data Manager and identifying the Data Set you want to work with. You can either click into the Data Set or select ‘Add New View’ from the dropdown to quickly jump to your Views. Once you’ve navigated to your Data Set, follow these steps to create a new View.
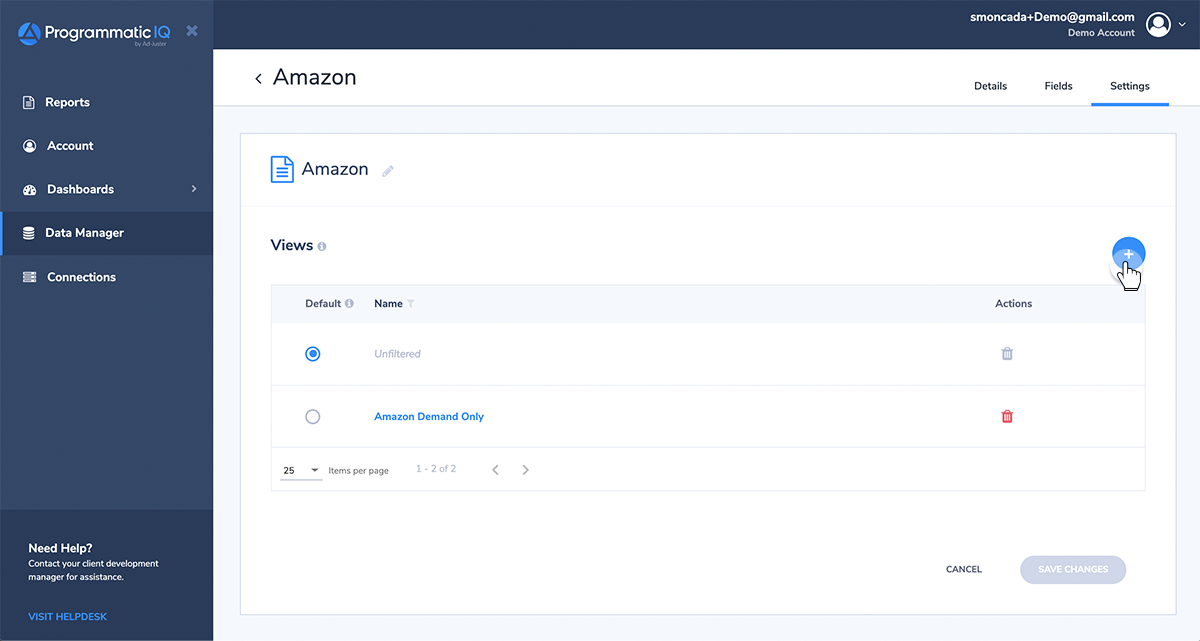
1. Navigate to the ‘Settings’ tab in your Data Set.

2. Click on the plus button in the Views section.
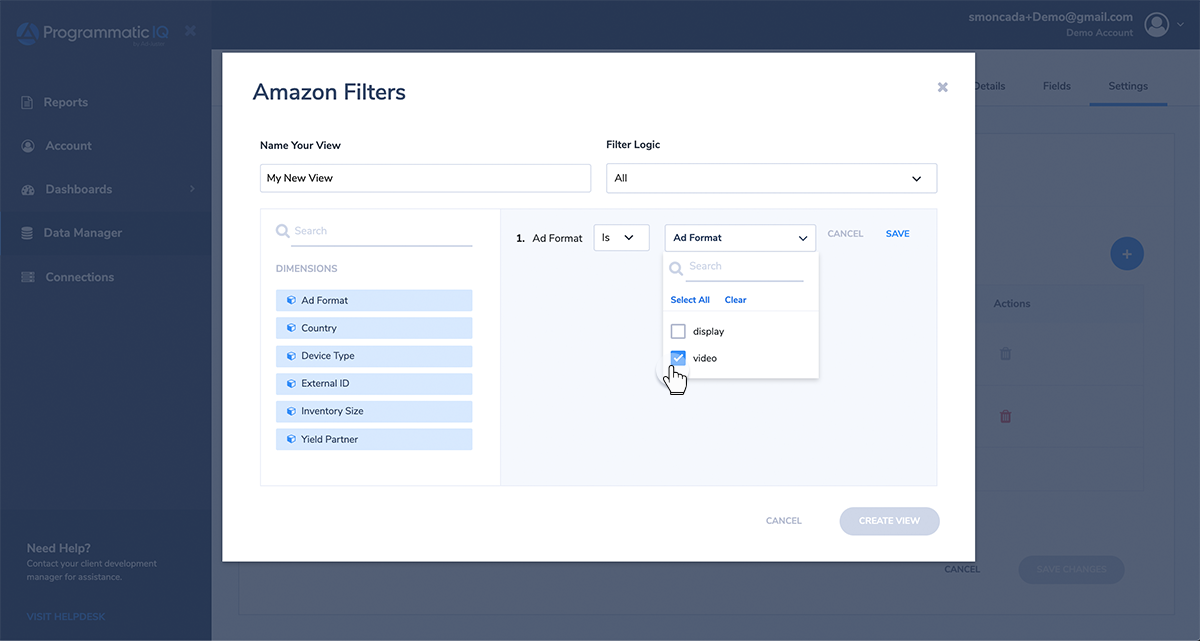
3. Enter a name for your new View and create your filters.
Give your View a unique name and select the dimensions you want to filter on. You can also set the filter logic for a View with multiple filters. Selecting ‘All' for your filter logic will interpret your filters as an "AND" (logical conjunction). Using 'Any' will interpret your filters as an "OR" (logical disjunction).
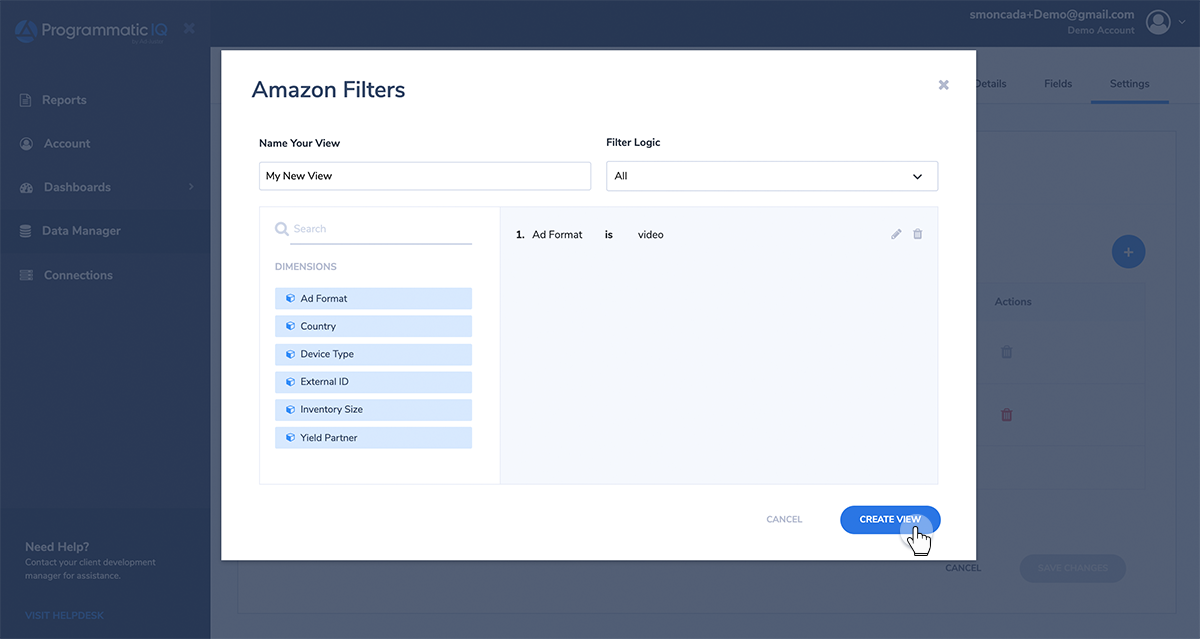
4. Save your filters and click ‘Create View’.
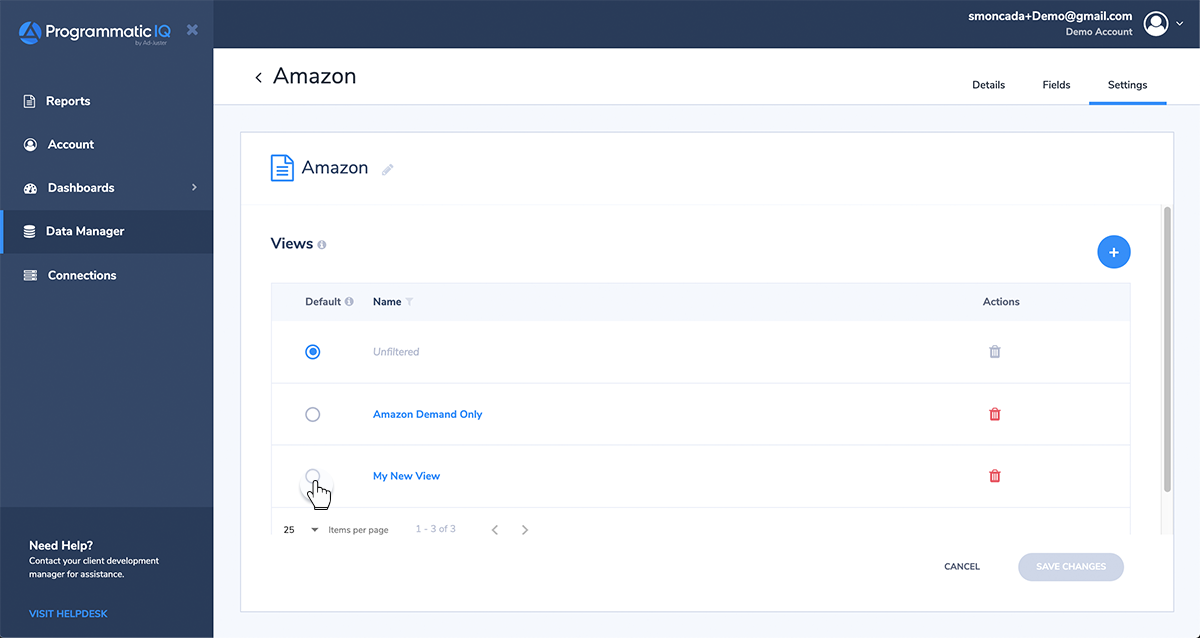
5. Select a default View for your Data Set.
Your default View will be automatically selected when creating Aggregate Data Sets, reports, and visualizations. You will still be able to select a non-default View when going through these flows.
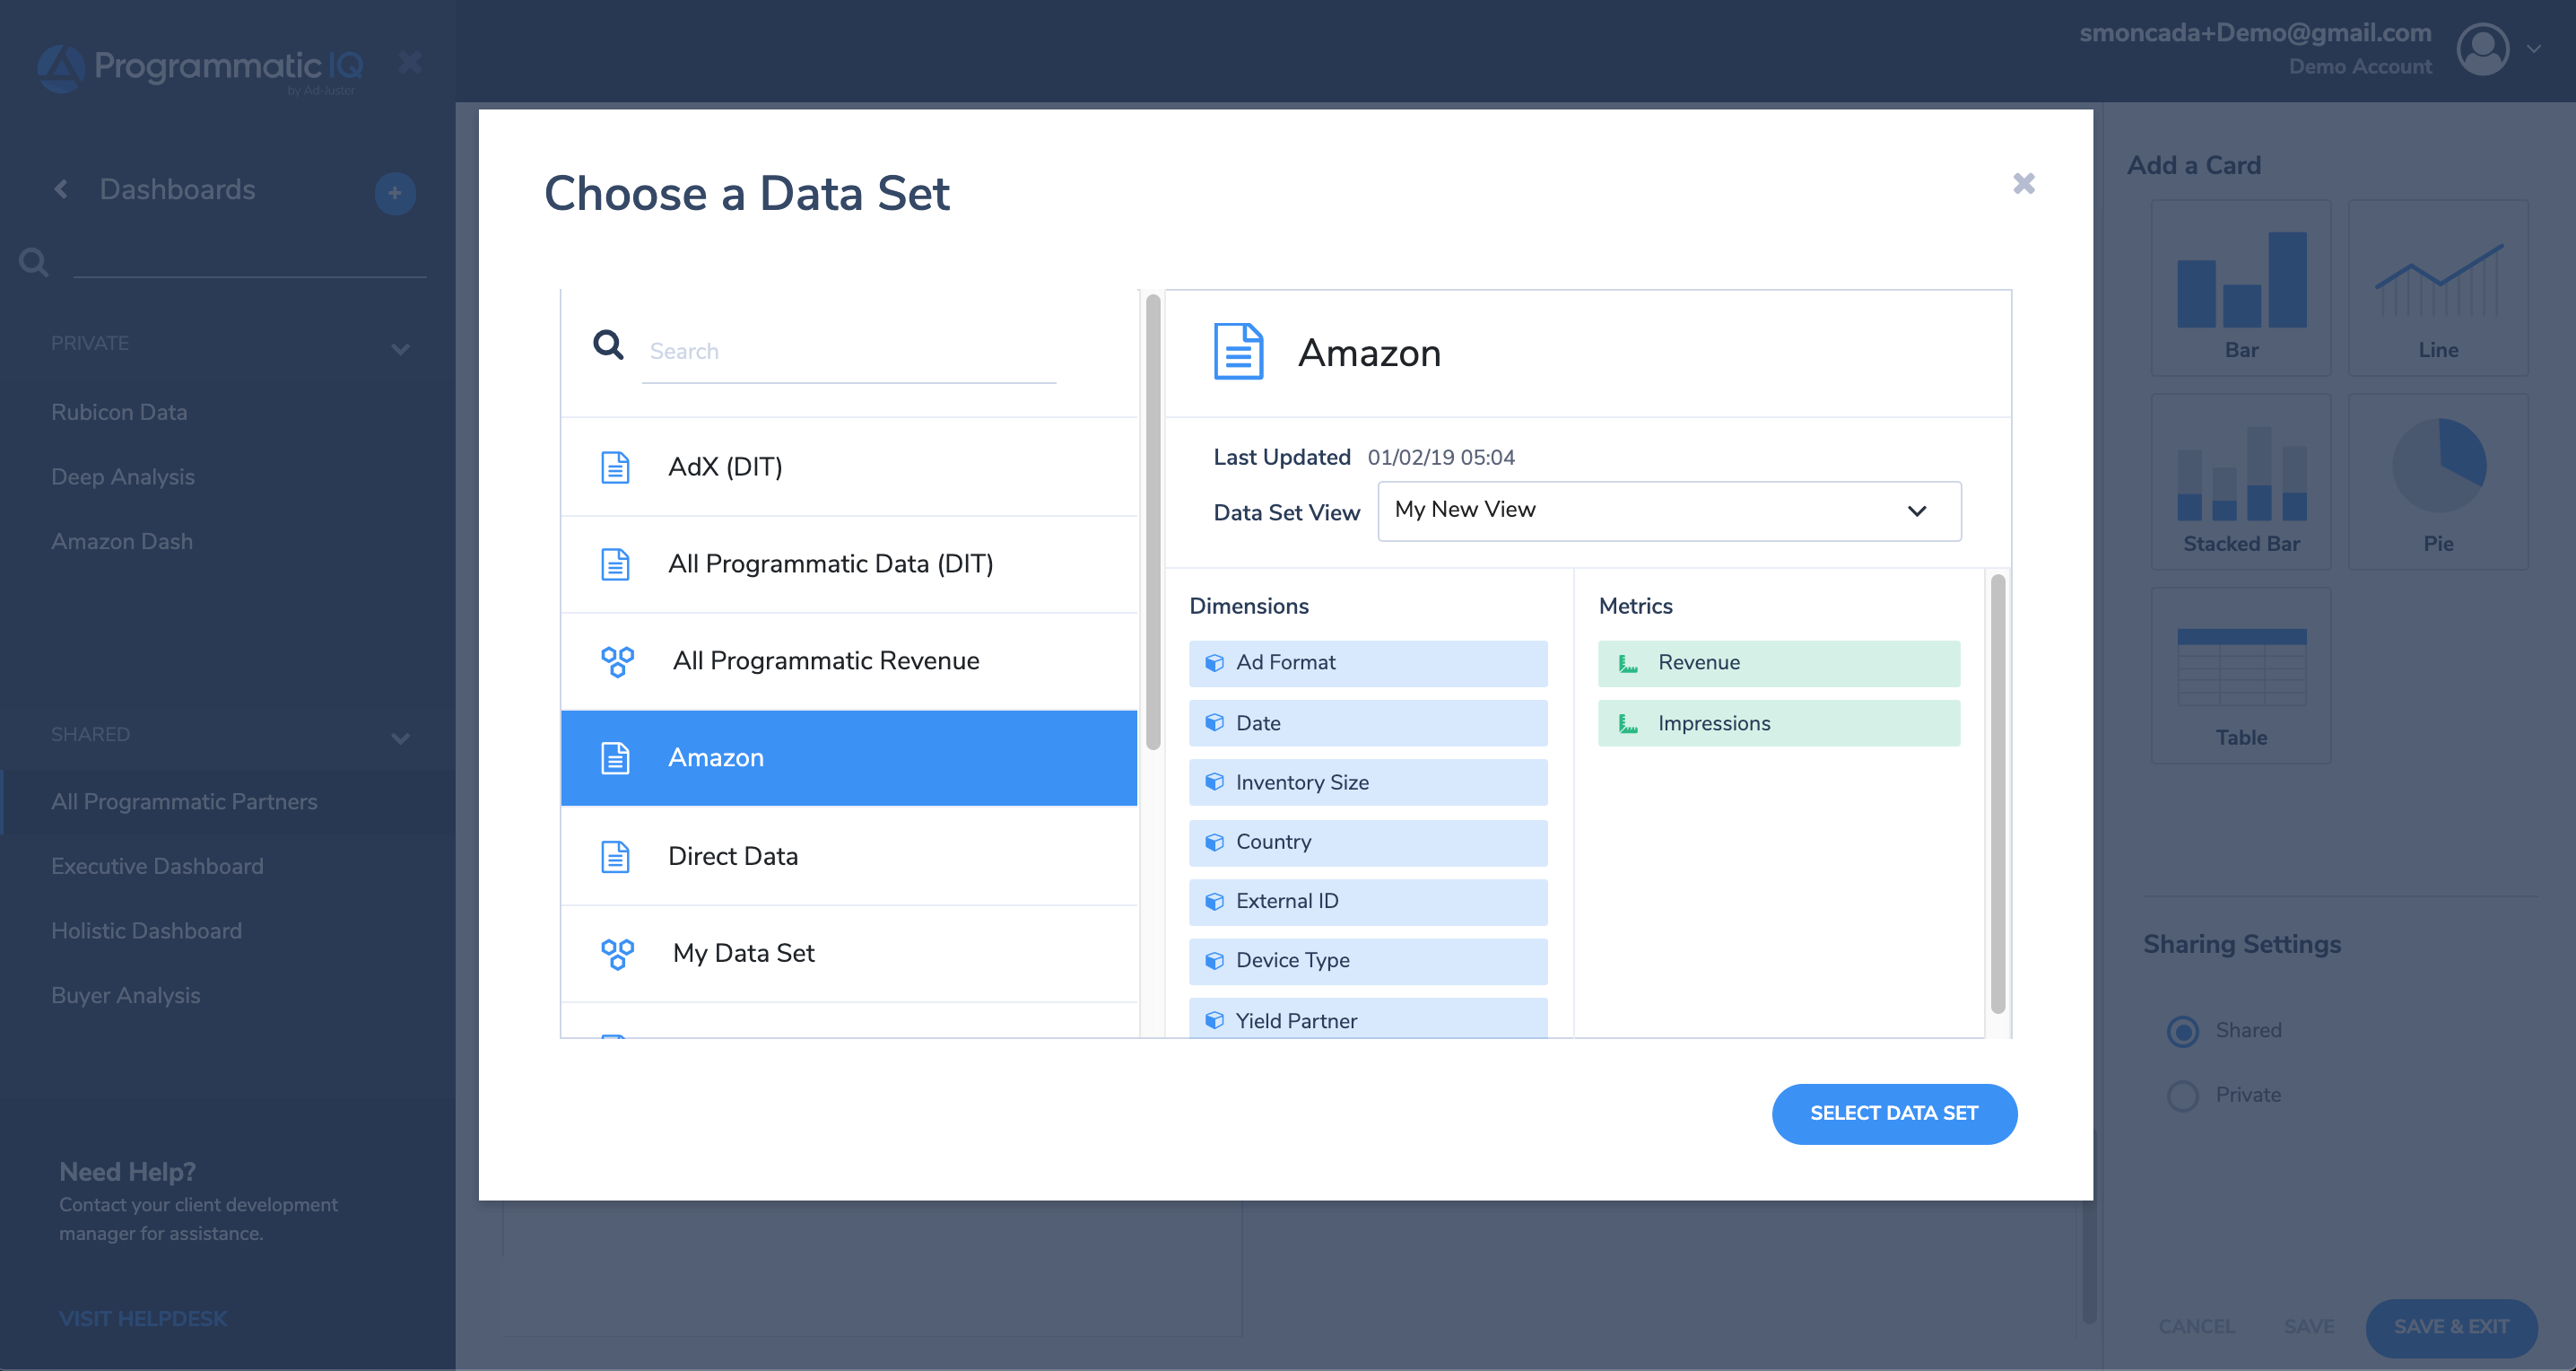
6. Use your view in your reports and dashboards.
Custom Fields in Views: When creating a View, only the native fields from the Data Set will appear in your view. You can then create unique Custom Fields specific to each individual view in the ‘Details’ tab.
We built Data Set Views to give you more flexibility and control over your data. What do you think, will this add value to your workflow? Or is there another feature you’d like to see us explore? Let us know!