The digital advertising industry is in the midst of a data revolution. As companies have shifted toward data-driven decision making, data granularity has become the primary momentum behind the evolution of a data-driven digital marketplace. It is now necessary to handle a tremendous amount of data daily to remain competitive and drive revenue growth.
Data matters. But the truth is that many publisher organizations aren’t using their data to its full capacity, due to lack of resources, processes, or tools. They have managed well enough thus far, but as the industry continues its inevitable growth into a data-driven culture, advanced data analytics are going to become a vital part of daily operations.
So, what do advanced data analytics look like?
That’s where the data analytics maturity curve comes in.
The publisher data analytics maturity curve was created to give publishers perspective on their analytic processes by providing a way to identify where their workflow lies on the curve and see what’s possible with greater data maturity. Each stage acts as a step-by-step framework to build upon.
This post will establish the data analytics maturity curve, define the points along the data maturity path, and take a look at some steps publishers can take to move themselves up the curve.
Understanding The Data Analytics Maturity Curve
Now that we’ve covered why the maturity curve was created, let’s take a look at the different stages of the model.
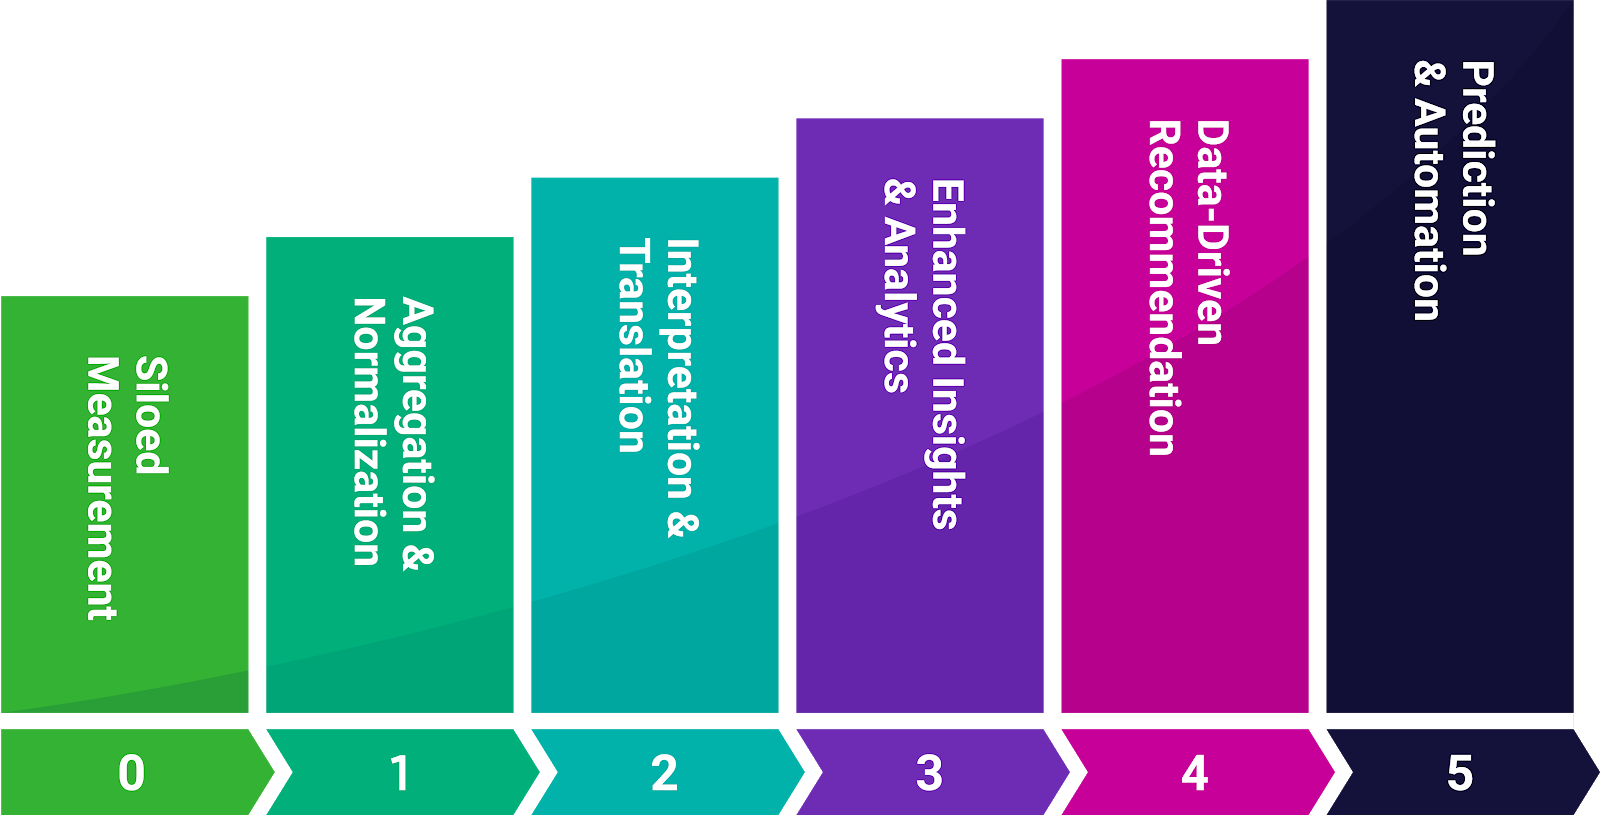
0. Siloed MeasurementAt the base of the maturity curve sits siloed measurement, wherein data is gathered from single sources and viewed singly. If data is pulled from multiple vendors and not aggregated, the siloed data will only offer an obfuscated view of your performance making deeper analysis difficult. For example, pulling one data set from an agency ad server and making optimizations based on that information will cause inventory issues, like overbooking and inaccurate forecasting, because you haven’t included data from your ad server and OMS. Siloed measurement lacks the context of a larger data story.
1. Aggregation, Mapping & Normalization
The next phase in data maturity is the ability to aggregate data from multiple sources and normalize like values across data sets. In practice, this means gathering data into a single, immediately usable file with fields mapped from each data source and values with varied naming conventions (e.g. Advertiser and Country) deduped. This step in the maturity curve represents the first step toward a holistic picture of your data that enables more sophisticated analysis and decision-making.
2. Interpretation & Translation
The next step up the curve involves matching line items across servers, platforms, data partners, and other sources so that the data set is accurate and usable. While this can be accomplished manually, the process is unrealistic to execute at scale and should be automated. By automating tag mapping and line item matching across platforms, publishers can troubleshoot delivery issues and resolve discrepancies. This also frees up team members to focus on revenue-generating optimizations rather than reporting preparation, which opens up further revenue opportunities, like the ability to fully explore inventory potential with advanced campaign planning and cost analysis.
3. Enhancing Insights & Analytics
At this point, data silos have been eliminated and data gathering has been automated. Once you’re comfortably able to process and cleanse data so that it is usable, you can start molding it into analyzable visualizations. Incorporating an advanced analytics tool that includes sophisticated reporting capabilities and visualizations into your workflow can 1) help track and highlight areas needing immediate attention in a clear, precise format and 2) allows your team to easily digest information and provide insights. These insights provide a path to maintaining peak campaign performance and capturing the highest possible revenue potential.
4. Data-Driven Recommendation
In this penultimate point on the climb up the curve, enhanced insights become automated. From a workflow perspective, this looks like being delivered data-driven recommendations that your team can quickly act on. In practice, this might look like an analytics tool highlighting discrepancies within a campaign and then issuing a notification recommending a change to your buffer, for example.
5. Prediction & Automation
In practice, this stage would look like an analytics tool that can 1) monitor your performance, 2) automatically predict trends based on prior data, and 3) make the recommended adjustments, such as floor pricing, in the appropriate platform without any manual intervention. Using advanced automation in this way ensures campaign performance remains optimal with minimal oversight.
The data analytics maturity curve was developed to provide the basic architecture for a successful, scalable analytics process. Each step’s progression builds upon the structure provided by the last. The goal of the curve is not to jump immediately from 1 to 6 but to provide a scale to assess where your process sits currently and a path forward for incorporating more refined analysis into your workflow.
5 Ways to Move Up the Maturity Curve:
With that in mind, let’s take a look at a few steps that publishers can take to move upwards on the data analytics maturity curve.
1. Adopt automation
Implementing automation in your processes can have several positive impacts on workflow. Manual tasks eat up time and effort and leave data vulnerable to human error. Automating these tasks frees employees to use their time for higher-level decision making and ensures accuracy within data sets. Workflow automation brings scalable efficiency and reliability to the data analytics process.
2. Customize your data
Utilize tools that can accommodate custom formulas and fields (e.g. custom columns) to better match your analysis to your revenue strategy. This type of customization can help publishers draw deeper insights based off of the unique needs (and related metrics) of each use case.
3. Consider process and tools you have in place for analysis and optimization
When examining ways to further your analytics, it is helpful to consider how you are viewing and communicating your data. Using visualization tools to report and display data is an excellent way to enhance your analytics and insights, paving the way for better data-driven decision-making. For example, when reporting on important campaign data, visualizations can make it easier to pinpoint areas that need attention. Visualizing data is also helpful in communicating to stakeholders in a clear and impactful way.
4. Shift toward a data-driven culture
Cultivating a data-driven culture can help move your team onward and upward at a faster clip. A large part of this involves democratizing your data so that every employee is able to access data and is empowered to deliver more informed insights within their role. This type of open, data-driven environment also enables teams from different departments to better communicate and collaborate because everyone agrees on a single source of truth. For more about what a data-driven culture looks like in practice, take a look at our blog post, 4 Characteristics of a Data-Driven Culture.
5. Business symbiosis
In nature, an ecological niche is the specific role a species fills in its environment. Species within different niches often develop symbiotic relationships with others based on mutual benefit. Like in nature, businesses often fill unique niches and can benefit from forming relationships with other businesses in another discrete business niche. For example, a publisher’s specialty is creating content and engaging with their audience, and therefore their highest ROI will come from spending time creating and optimizing. Likewise, a data analytics provider specializes in the reporting and analytics tasks of operations, their entire niche dedicated to refining the way your data is ingested, analyzed, delivered, and visualized. Building relationships with vendors in their own specialized niche leaves you free to pursue your core competencies while trusting that your data partners are doing the same.
Putting in the effort to implement these steps can help you push your way up the data analytics maturity curve and prepare your workplace for the inevitable extension of the curve as new data analytics technology becomes available. The work you put into expanding your workplace’s data-driven culture, developing symbiotic business relationships, and adopting automation will make for smoother transitions down the line.
To Wrap Up:
Strong, automated data analytics processes will continue to be a necessity for publishers as more and more complex and granular data is leveraged to drive revenue growth. Using this model can help publishers establish where their data analytics workflow is currently operating and provide the scaffolding upon which you can build out your analytics process. The further up the maturity curve you are the more revenue you generate per hour spent, and the more efficient you’ll be with your inventory.
Interested in learning more? Contact us! DoubleVerify can help strategize how to move your business up the maturity curve.